
Your campus app is live. communication seems smoother, students are connected, and important information no longer gets lost in a flood of emails. is the mission accomplished? in reality, the most exciting part is just beginning. the greatest value of your app may lie in a still-hidden treasure: the usage data it generates every day.
This informational goldmine, when properly utilized, is the most powerful lever for moving from intuitive communication to a data-driven strategy aimed at truly improving the student experience. this article will guide you on identifying the right data to track, how to interpret it, and, most importantly, how to turn it into concrete, beneficial actions for your community.

It’s time to change your perspective. your app isn’t just a megaphone for broadcasting information; it’s a true barometer of campus life. every click, every event registration, every consultation of a resource is valuable information that reflects the needs, interests, and behaviors of your student community. analyzing these interactions gives you a direct, authentic insight into what really concerns, interests, and mobilizes your students.
Of course, it’s crucial to approach this process ethically and in strict compliance with GDPR. the goal is never individual surveillance, but rather the analysis of aggregated and anonymized trends. the purpose is to improve services for everyone, with full transparency and respect for users’ privacy.
To avoid getting lost in a sea of information, it’s helpful to focus on a few key indicator families. start by tracking adoption and general usage indicators, such as the app’s activation rate among your students or the number of daily active users. these figures give you a global view of the health of your digital ecosystem.
next, dive into content engagement indicators. analyze which news feed articles are most read, which resources are most downloaded, or which sections of the app are most visited. this data tells you about your students’ interests. campus life participation indicators, such as the event registration rate or the number of votes in polls, measure the dynamism of your community. finally, social interaction indicators, like the number of messages exchanged in groups, are an excellent thermometer for social connections within your institution.

Once the numbers are collected, you have to make them talk. here are some concrete examples of translating data into insights.
Your students deserve a better experience
The Edusign app centralises timetable, news, attendance and alerts — in your institution's branding.
Analysis is only valuable if it leads to concrete actions. every insight should result in a decision aimed at improving the student experience. if news articles are rarely read, you can adapt your content strategy by trying shorter, more visual formats or conducting student interviews.
if administrative information is highly sought after, this justifies optimizing your services by creating a dynamic faq section in the app or integrating a simple chatbot to answer the most frequent questions 24/7. if push notifications are popular, decide to reserve them for truly important messages so you don’t overuse this powerful channel. finally, if a club is particularly good at community management, organize a best-practice sharing session to inspire other club leaders.
One of appscho’s major strengths is going beyond simple communication. the platform integrates analysis features that transform raw data into strategic management tools:
💡 The Result: your app is not just a communication channel; it’s a true observatory of the student experience, allowing you to anticipate, adjust, and innovate continuously. ✨
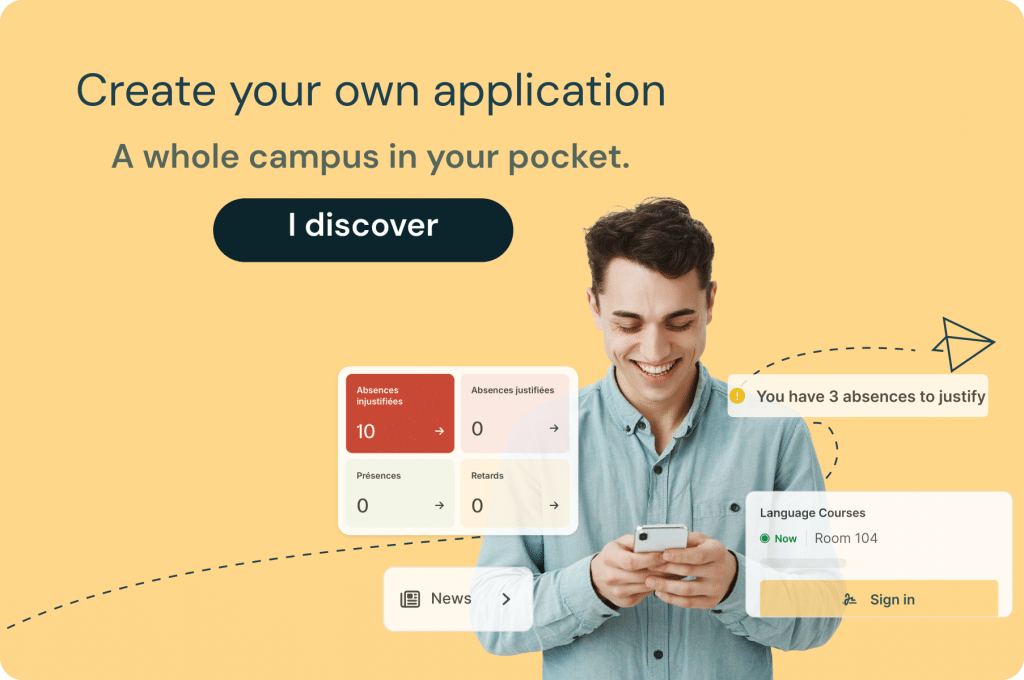
The data from your campus app is much more than just a series of numbers. when analyzed correctly, it’s the echo of your community’s needs, desires, and behaviors. listening to and interpreting this data transforms your communication from a top-down monologue into a true dialogue, placing your institution in a virtuous loop of continuous improvement for the student experience. this data-driven approach allows you to build a campus experience that is not just offered to students, but is co-created with them, based on their real usage and feedback.
appscho by edusign is designed to provide you with not only the communication tools but also the analysis data needed to drive your engagement strategy. discover how to take it to the next level.
Criteria, formats and benefits of e-learning platforms: everything you need to choose the LMS that best fits your learners and your training strategy.
Corporate training is now essential. It maintains every employee's employability — and also contributes to their well-being and mental health at work.
Discover how these unique learning sessions are transforming training. Learn what a master class is, its origins, formats, and how to make the most of it.